The Church of St. Catherine in Casale Monferrato is an important example of Piedmont Baroque architecture. Dating back to the 17th century, the church is famous for its majestic frescoed vault and its historical and artistic value. In recent years, due to natural deterioration and environmental phenomena, a continuous monitoring campaign has been initiated to ensure its preservation and prevent structural damage.
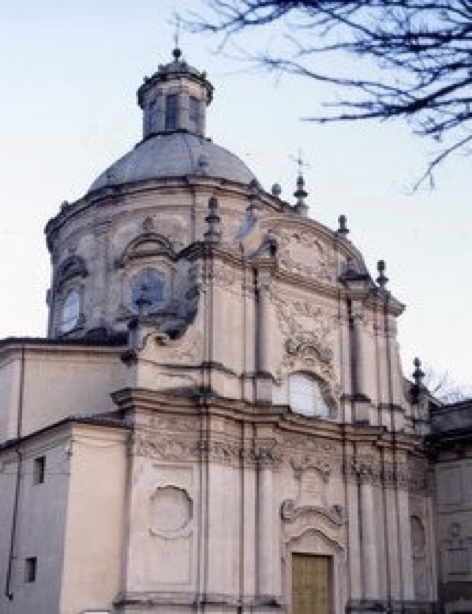
Fig.1 St. Catherine church facade, Casale Monferrato
For St. Catherine’s, Moni2Bsafe installed a permanent monitoring system focused on the vault of the church, one of the most delicate and vulnerable elements. The monitoring system involves the use of 10 environmental sensors that constantly detect temperature and humidity, two factors that can affect the structural stability and conservation of the frescoes. In addition, 5 threshold accelerometers have been installed, advanced instruments that detect even the slightest vibrations or movements of the structure, in order to detect any subsidence or displacement that could compromise the integrity of the vault. Thanks to this system, the data collected in real time allow a continuous monitoring of the state of the church, allowing timely intervention in case of anomalies.
The next image highlights the location of the sensors inside St. Catherine’s Church.
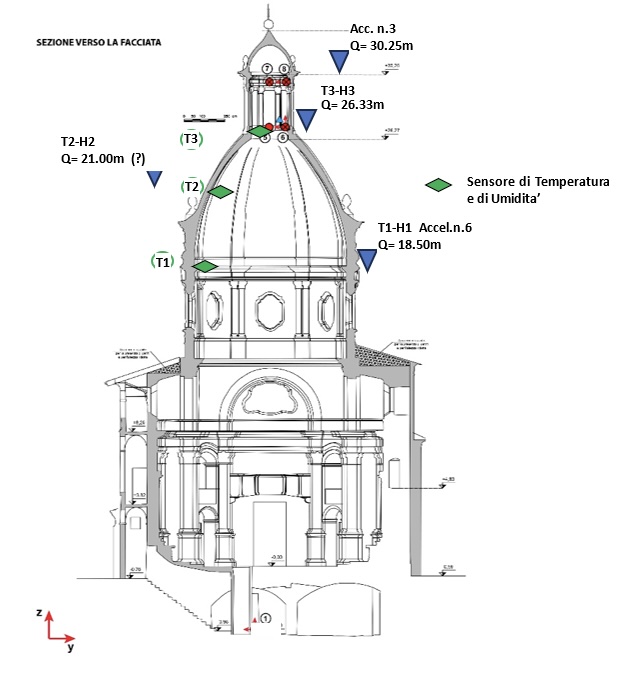
Fig.2 Sensor location diagram.
Temperature and humidity sensors T3 and H3 (the highest) are located at approximately 26.33m from the floor level of the church. T2 is located at an intermediate height on the inner surface of the dome, and sensor T1 is located at the height of the drum, about 18.50m from the floor level of the church.
The sensors are digital and can measure temperature from 0 to 50°C with an accuracy of ±2°C, and humidity from 20 to 90 % HU with an accuracy of approximately ±5 % HU.
The sensors are each connected to a Wifi controller programmed to read temperature and humidity data every 15 minutes and transmit it via Wifi to a local network (access point) about 20-30 meters below, which in turn transmits via a telephone provider’s data line to a data server (which collects all the data) on a remote computer. Data collection was interrupted from August 16, 2023 to September 9, 2023 due to lack of power.
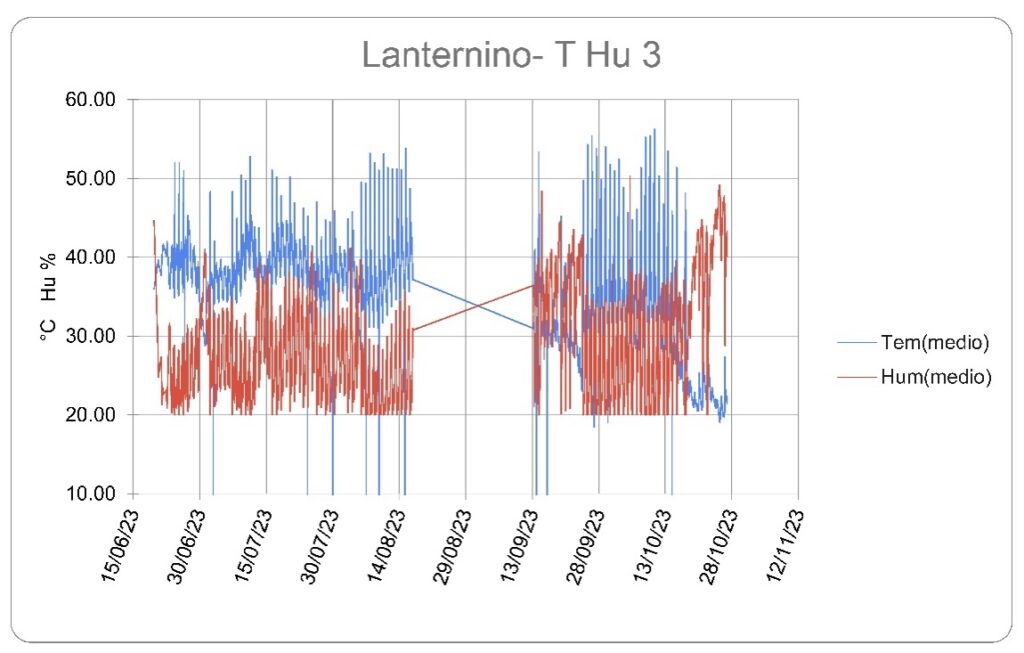
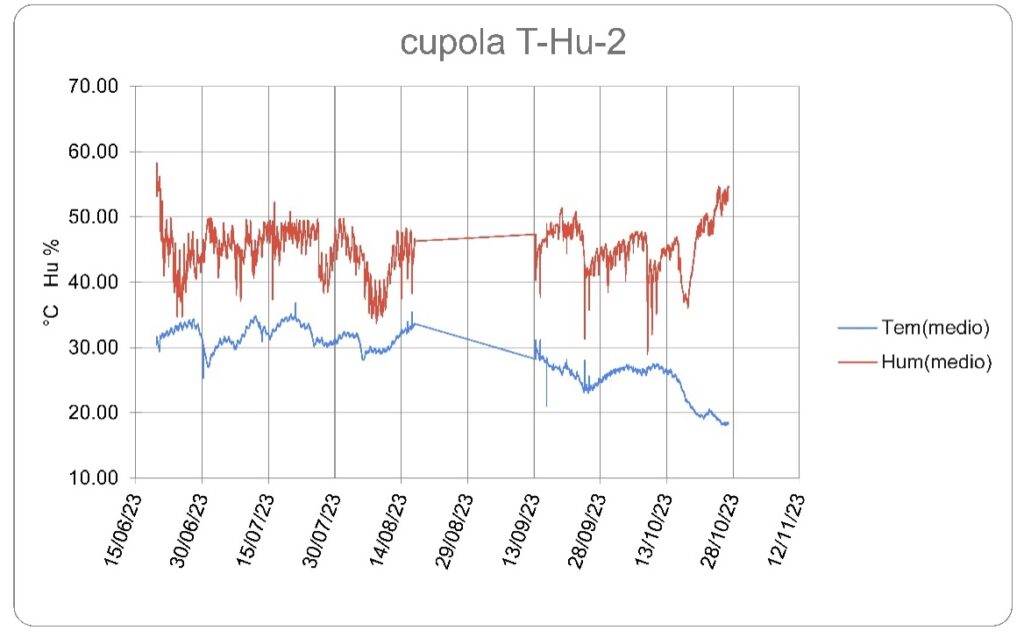
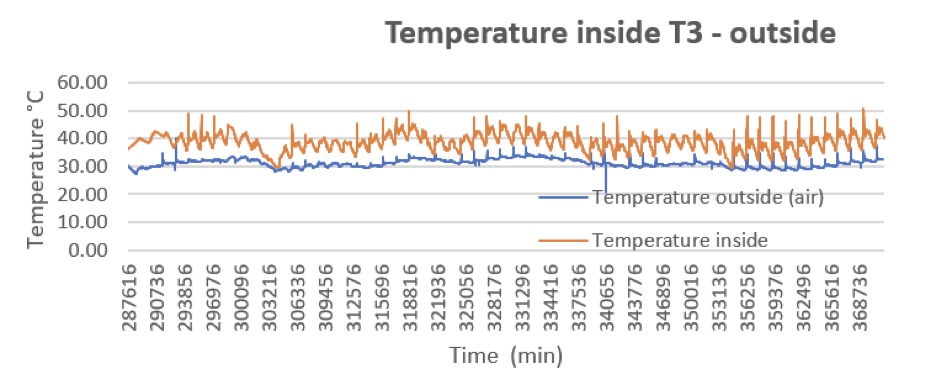
Fig.3 Temperature and humidity graph over time.
The temperature data collected inside the church were compared with the environmental data collected by the weather station in Casale Monferrato, located in the CREA building, i.e. the Institute for Poplar Cultivation, about 5 km away as the crow flies. Due to the different sampling (the weather station samples and records data every half hour, while the installed temperature sensors sample and record every 15 minutes), also due to some interruptions caused by uncertainties in the data transmission, it was necessary to realign all the data from both records on a minimum sample size sub-sample (15 minutes) and then compare the normalized results.
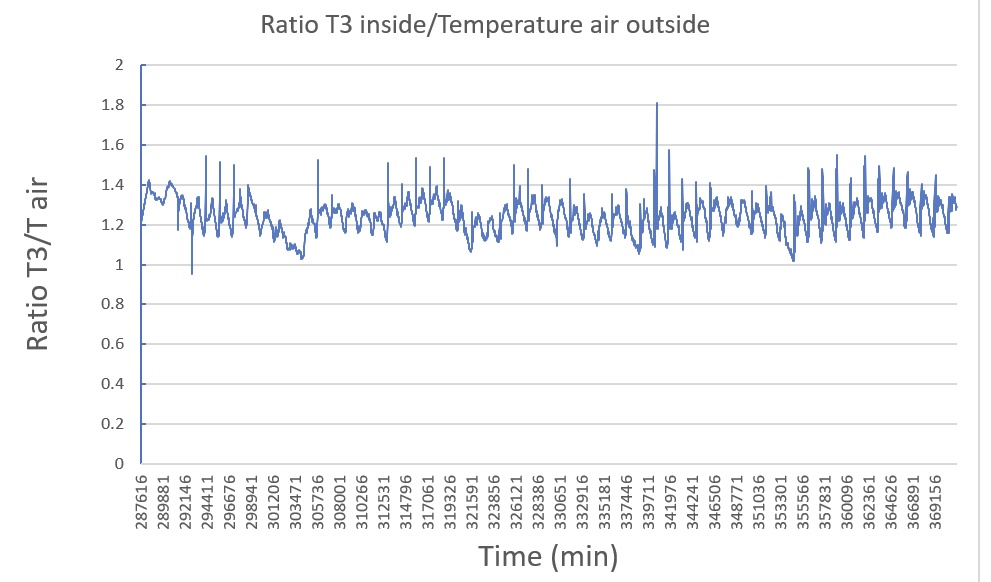
The ratio of indoor temperature to outdoor temperature was also calculated .
Monitoring is an important step in the preservation of a priceless architectural and historical asset, ensuring that St. Catherine’s will continue to be admired by future generations.